


 x 90px (h)")
 x 90px (h)")


 x 90px (h)")


![]()
Open-Ed
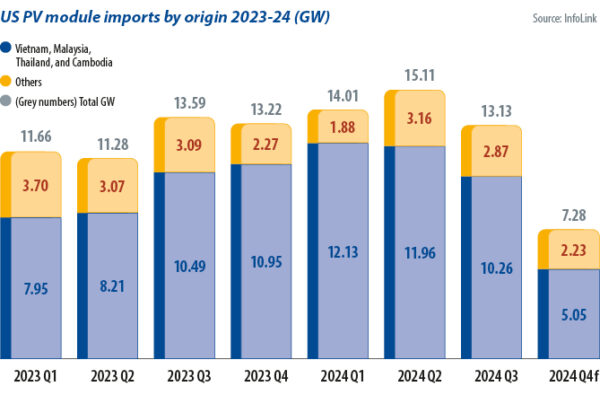
The imposition of AD/CVDs by the United States on solar modules from Vietnam, Malaysia, Thailand, and Cambodia has seen imports from those nations decline sharply. With U.S. developers reliant on imports for now, countries outside those territories should benefit, although Malaysia could become more prominent, as its duties have been revised down.
U.S. thin-film PV manufacturer First Solar is set to account for 20% of its home market. Imported cells topped the 12.5 GW duty-free U.S. quota during 2024, highlighting growth in U.S. solar module assembly against a small number of homegrown cell manufacturers in production at the end of the year. U.S. cell production should drive up domestic solar manufacturing overall in 2025.
Stagnation and uncertainty
Imports will still be needed, perhaps from Malaysia and, more likely from outside China, Vietnam, Thailand, and Cambodia. US solar demand could slow thanks to the slow ramp-up of domestic manufacturers and trade policy uncertainty.
For US solar to sustain growth, it is crucial to monitor import policies and to assess the likelihood of continued subsidies under the Inflation Reduction Act (IRA). If IRA incentives are weakened, many planned utility-scale projects may be delayed or canceled. The United States is also developing policies related to “foreign entities of concern,” aiming to prevent Chinese-funded enterprises from receiving IRA benefits for establishing manufacturing facilities on US soil. That will significantly affect PV manufacturers planning to set up United States factories, as well as investment decisions for PV projects.
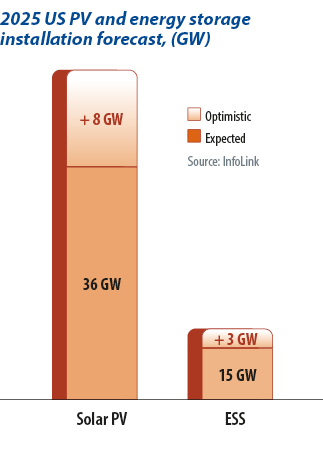
US solar demand is expected to have reached approximately 38 GW to 42 GW in 2024 and could move to anywhere between 36 GW and 44 GW in 2025.
Energy storage
The U.S. energy storage market demonstrates a steadier growth trend. The market is still dominated by the utility-side, “front-of- meter” segment, which accounts for more than 90% of installed capacity. In 2024, the five largest U.S. markets were California, Texas, Arizona, Nevada, and New Mexico, with California and Texas jointly accounting for more than 65% of the nation’s total energy storage capacity.
Projects in California had an average storage duration of four hours, higher than the national average of 3.1 hours. By contrast, Texas had an average storage duration of approximately 1.7 hours, largely unchanged from 2023. With a significant increase in the number of operational projects, however, Texas has become one of the fastest-growing energy storage markets in the country.
Antidumping investigation preliminary rulings
The development of the US energy storage market has been driven by various policies, including federal subsidies, support at state level, and growing demand from grid operators. The 30% investment tax credit (ITC), which standalone energy storage systems are eligible for under the IRA, is expected to remain available for now. The California Energy Commission and the Public Utility Commission of Texas are actively promoting energy storage development.
 In 2025, uncertainty in the US energy storage market is increasing because energy storage-related stimulus policies may be canceled or suspended under the Trump administration. On the other hand, a continued escalation of solar import tariffs could drive a surge in storage installations. InfoLink predicts that the US energy storage market will continue to grow, but market competition may become more segmented. In particular, the advancement of large utility-scale projects and long-duration energy storage technology will be key areas of future development.
Alternative markets
Despite a potential slowdown in the US market, the European region is expected to maintain steady growth in PV and energy storage demand, driven by long-term energy strategies. Additionally, the global PV and energy storage market will experience significant support from emerging markets in 2025.
Clean energy industries in the Middle East and India are both experiencing rapid growth. The annual growth rate of PV demand in those two regions is expected to exceed 30% to 50% in 2025. In the energy storage sector, the Middle East market is projected to see an annual growth rate of more than 300%, with storage installations potentially reaching 13 GWh this year. While India’s energy storage market is still in its early stages, the number of tendered projects continues to rise and the anticipated implementation of mandatory storage policies suggests an emerging, long-term growth trend.
Southeast Asia and Africa are developing steadily. With increasing investment in green energy, PV and energy storage demand in those regions continues to rise.
Growth in the Middle East, India, Southeast Asia, and other emerging markets is expected to offset the short-term impact of slowing US demand caused by policy uncertainty. Those non-US markets will continue to drive the global energy transition and ensure long-term growth in PV and energy storage. Companies are advised to closely monitor policy changes, effectively optimize market strategies, and proactively enter growth markets to seize emerging business opportunities and maintain a competitive edge in the energy transition.
Author: Corrine Lin
 About the author: Corrine Lin is chairperson and chief analyst at InfoLink Consulting. She leads research teams in solar, energy storage, clean electricity, and carbon markets, with more than a decade of renewable energy business analysis experience. InfoLink works with more than 160 global enterprises, offering research and spot price reporting for the global PV industry. Lin drives InfoLink’s research, delivering strategic insights to help businesses navigate transformation.
This article was originally published in pv magazine and is republished with permission.
Disclaimer: The articles and videos expressed in this publication are those of the authors. They do not purport to reflect the opinions or views of Green Building Africa, pv magazine, our staff or our advertisers. The designations employed in this publication and the presentation of material therein do not imply the expression of any opinion whatsoever on the part Green Building Africa concerning the legal status of any country, area or territory or of its authorities.

