- From 2000-2022, China’s engagement with African countries through trade, overseas development finance and foreign direct investment (FDI) has bolstered ties and increased policy relations, particularly in the areas of development.
- Past trends in economic engagement have led to both benefits and risks to African governments, spanning economic growth and environmental impacts on biodiversity.
- Nonetheless, China’s presence throughout the region has produced lessons that could inform the next phase of African countries’ development trajectories.
African countries are currently emerging from several years of economic challenges brought about by the COVID-19 pandemic, Russia’s war in Ukraine and the climate crisis. These events have led to contractions in economic growth, global supply chain disruptions and the rise in the prices of energy products and food sources such as wheat. US dollar effective exchange rate increases have led to an expansion in dollar-denominated debt, thereby worsening the costs of servicing debts. A growing portion of government revenue is servicing debt repayment rather than addressing pressing development goals.
Despite such challenges, the global energy transition present opportunities to reach aspects of Africa’s low-carbon development goals, particularly pertaining to energy access and transition. Access to enough capital or beneficial economic exchange is a hurdle toward reaching this goal. Given China’s past years of economic interactions with African countries, China is one of many country partners poised to contribute solutions to this challenge.
The charts below illustrates one of the key findings from a new report published by the Boston University Global Development Policy Center and the African Economic Research Consortium. The charts highlight that Chinese economic engagement pertaining to energy and transition materials entails support for electrification and extraction. In the future, Chinese trade, finance and FDI should prioritize contributing to electrification infrastructure, while balancing extraction activities to align their economic engagement more closely with Africa’s energy access and transition goals.
Chart 1: Share of Primary Energy Consumption in Africa by Source, 2000-2022
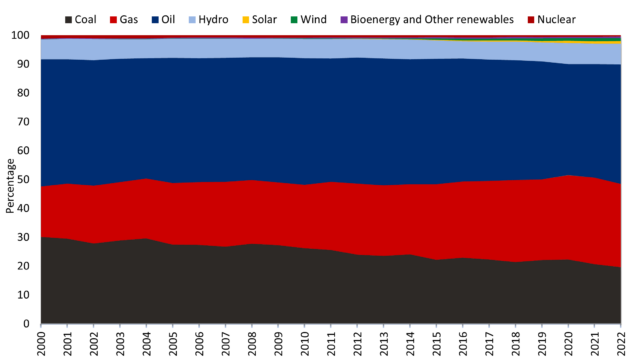
As African countries shape their development goals around the United Nations 2030 Sustainable Development Goals (SDGs) and the African Union Agenda 2063, priorities of energy access and transition remain paramount. In 2021, 43 percent of Africa’s population did not have access to electricity, and of the population with access, 90 percent of energy consumption relied on fossil fuels (coal, oil and gas), as seen in Chart 1. Capitalizing on Africa’s renewable energy potential could contribute significantly to addressing these challenges, as Africa’s wind and solar potential are among the highest in the world. One of the essential factors needed for unlocking this renewable energy potential is access to channels of economic engagement with external partners.
Chart 2: Africa-China Trade Balance, 2000-2022
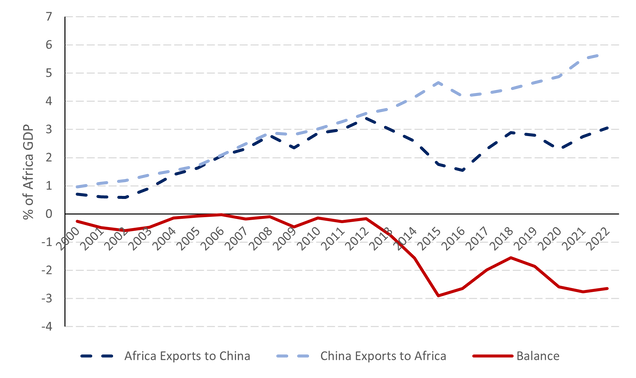
Africa-China trade engagement is significant but has largely moved from relatively balanced trade to trade deficits for African countries, as seen in Chart 2. From 2000-2022, Africa-China import and export values of goods increased from $11.67 billion to $257.67 billion. Throughout those years, African countries’ top trading country partners have gradually shifted from predominantly the United Kingdom and the United States to China. Trade deficits for the African continent have accompanied deepened ties through three major periods of the global financial crisis (2008-2009), a decline in commodity prices (2014-2015) and a global pandemic (2020-2021). In 2022, a high import value of goods from China and relatively lower value of exports to China continued a trade deficit that landed at 2.6 percent of GDP in 2022.
Chart 3: Africa’s Exports and Imports to China by Sector
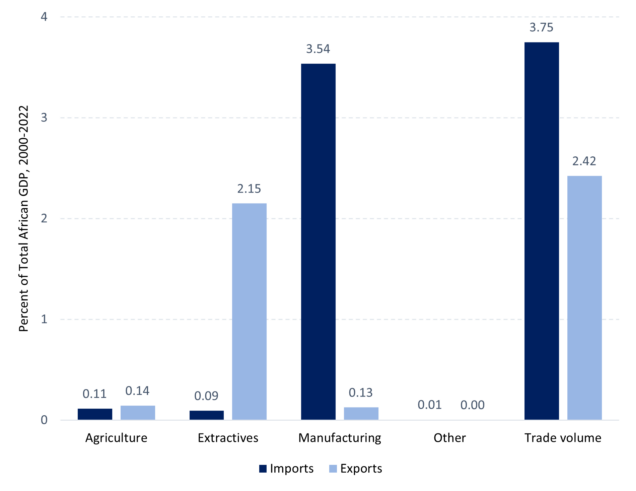
Chart 3 shows that African countries primarily exchange natural resources for manufactured goods in their trade relationship with China. In 2022, approximately two-thirds of Africa-China exports were concentrated in just four commodities: petroleum crude oil (41 percent), refined copper (15 percent), iron ore and concentrates (5 percent) and aluminum ores and concentrates (5 percent) by trade value. Largely due to the primary commodity exports, exports from Angola, South Africa, Sudan, the Democratic Republic of Congo and the Republic of Congo alone amounted to 69 percent of all total exports to China. Top imports from China were telecommunications equipment (6 percent), fabrics (3 percent), footwear (3 percent) and refined oil (3 percent).
The types of top commodities extracted and exported reveal insights into some of China’s past priorities in the region. Crude oil exports to China address domestic oil demand in China’s growing economy, while copper, iron and aluminum are inputs into the supply chains of green technologies such as electric vehicle batteries, solar panels and wind energy generation equipment. Imports of these renewable energy equipment that use Africa’s commodities are not a core aspect of the trade relationship, suggesting there is potential for China to boost the export of these technologies to African counties for the benefits of energy access and transition.
Chart 4: Chinese Loans to Africa by Sector in Billions USD, 2000-2022
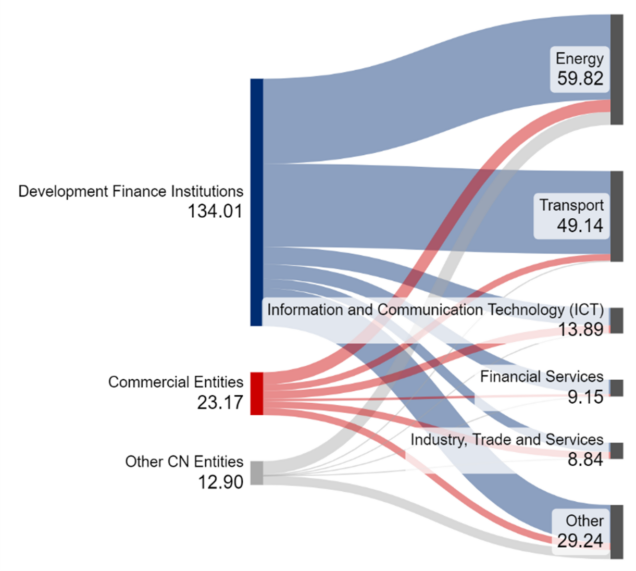
China’s overseas lending and development finance has contributed to infrastructure development throughout the region. Overall lending from 2000-2022 has amounted to an estimated $170.08 billion, of which $134.01 billion came from China’s development finance institutions, the China Development Bank (CDB) and the Export-Import Bank of China (CHEXIM). Development finance was primarily distributed to the energy, transport, information and communication technology (ICT), financial services and industry, trade and services sectors, as seen in Chart 4. Although this financing is significant in volume and impact, China’s lending has declined since its peak in 2016 and existing debt burdens and high global interest rates limit the ability to borrow more from China.
Chart 5: Chinese Loans to Africa: Energy Lending and Total Lending, 2000-2022
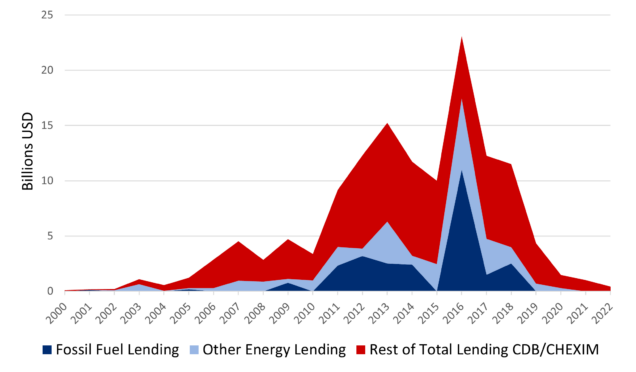
As seen in Chart 5, China’s overseas development finance in the energy sector is fossil fuel heavy, but targets both electrification and extraction purposes. At least 51 percent of the $52.38 billion in CHEXIM and CDB energy finance has been distributed to fossil fuel projects with oil, coal and gas energy sources. While lending for oil extraction largely dominates, shifts away from coal projects have been observed since China’s 2021 pledge to not finance new coal-fired power plants overseas. Finance to hydropower projects also constitutes a substantial amount of energy development finance at 31 percent, of which much is for the purpose of electrification.
In contrast, financing to renewable energy projects is at meager amounts, with only $975.11 million (2 percent) of DFI financing, only from CHEXIM, going to wind and solar projects likely due to knowledge gaps and technology risk perceptions regarding renewable energy technologies amongst DFIs. Surprisingly, there is also no evidence of development finance to sovereign governments for the purpose of transition material projects. Nevertheless, China’s energy loans have served the purpose of both electrification and extraction, where 54 percent of finance has supported power generation and transmission and distribution projects and 35 percent has supported extraction projects.
Link to the full report HERE
Author: Oyintarelado Moses for the Global Development Policy Center


