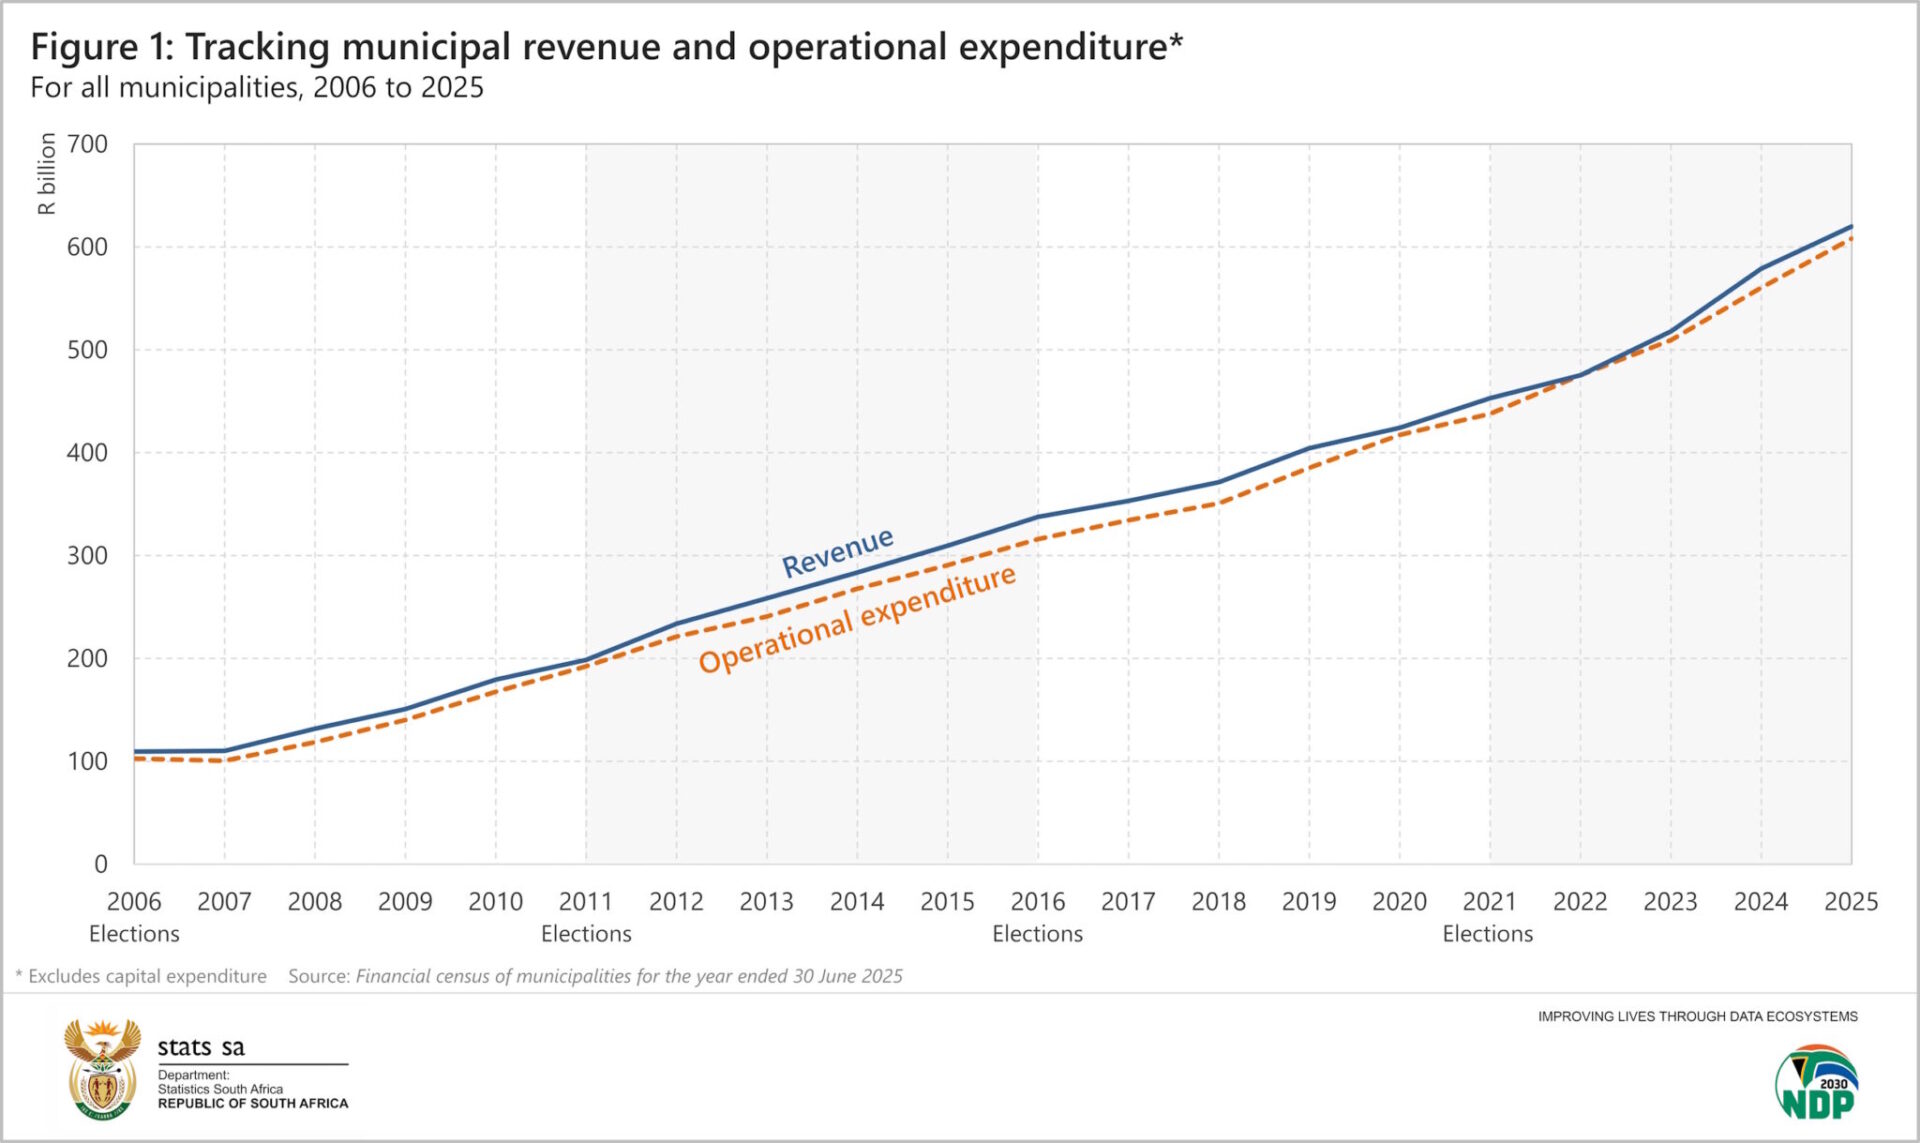
- Municipal revenue increased from R109 billion in 2006 to R620 billion in 2025, while operational expenditure rose to R608 billion.
- Government transfers accounted for 26.2% of municipal revenue in 2025, highlighting continued reliance on national funding despite a decline from 2009 levels.
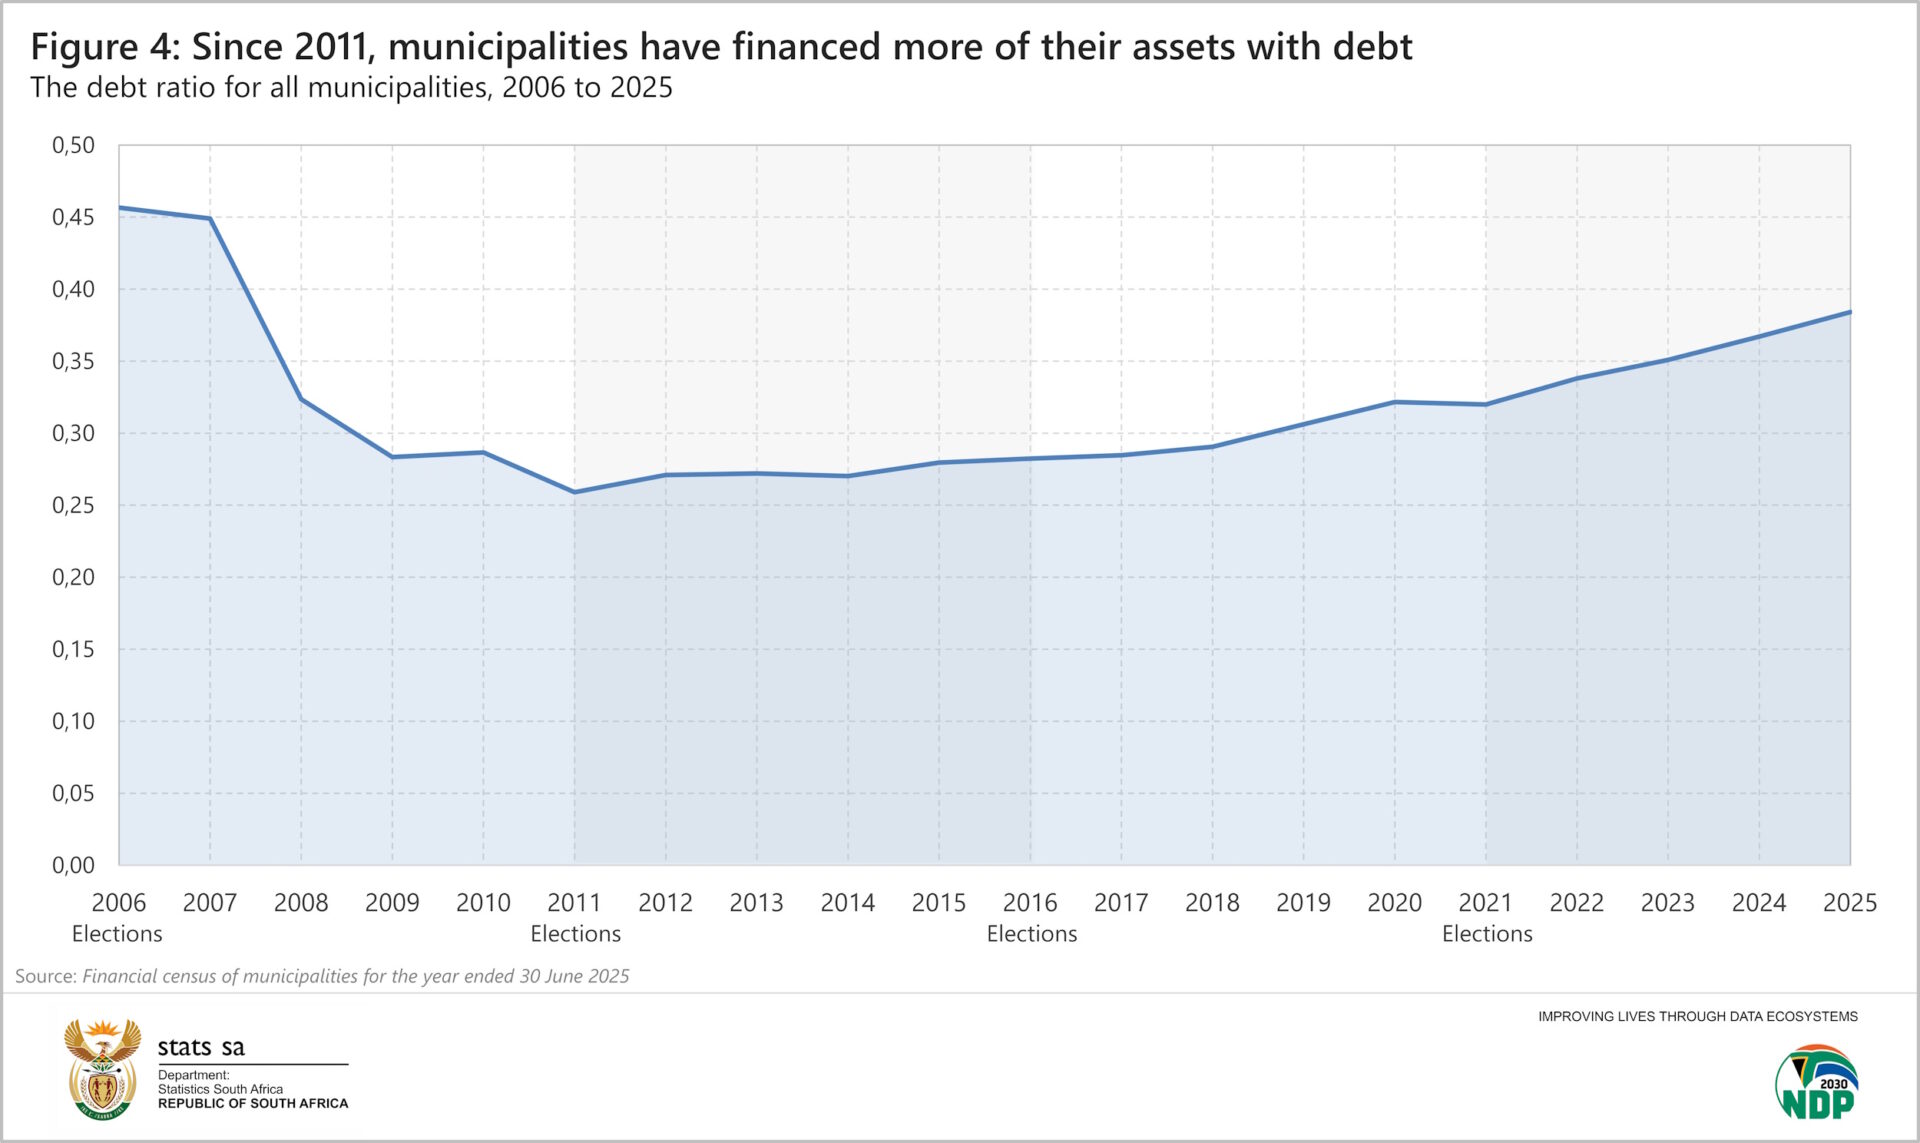
- The municipal debt ratio has steadily increased since 2011, signalling growing dependence on debt to finance assets.
South Africa’s municipalities have significantly expanded their revenue and spending over the past two decades, although growing debt levels and continued reliance on national government funding remain key financial challenges.
A review of Statistics South Africa’s Financial Census of Municipalities, which tracks municipal finances from 2006 to 2025, provides insight into the financial performance of local government across four election cycles, with the next municipal elections scheduled for 4 November 2026.
Collectively, municipalities generated R620 billion in revenue during 2025, compared with R109 billion in 2006. Operational expenditure also increased sharply over the same period, rising from R103 billion to R608 billion.
Three metropolitan municipalities accounted for one third of total municipal spending in 2025. The City of Johannesburg recorded the highest operational expenditure at R79 billion, followed by eThekwini Metropolitan Municipality at R60 billion and the City of Cape Town at R59 billion. At the opposite end of the scale, Xhariep District Municipality in the Free State reported expenditure of R75.7 million.
Employee related costs continue to represent one of the largest components of municipal operating budgets. According to the latest available employment data, South Africa’s 257 municipalities employed 289,796 people during 2023.
National Treasury recommends that employee related costs should account for between 25% and 40% of total operational expenditure. Municipalities have largely remained within this benchmark over the past two decades.
Employee related costs represented 24.8% of operational expenditure in 2006 before increasing to 28.9% in 2021. By 2025, the ratio had declined to 25.2%, placing it at the lower end of Treasury’s recommended range.
In 2025, 136 municipalities fell within the recommended range, while 37 exceeded the guideline and 84 reported employee costs below the benchmark.
District municipalities generally recorded higher employee cost ratios because many do not provide electricity and water services directly. Without these large operating expenses, staff costs account for a greater share of total expenditure.
Sedibeng District Municipality in Gauteng recorded the highest employee related cost ratio during 2025, with salaries and wages accounting for 76% of operational expenditure. Emfuleni Local Municipality recorded the lowest ratio at 12%.
The report also highlights differences in financial independence across municipalities. Revenue is generated through service charges, property rates and fines, while additional funding comes from transfers and subsidies provided by national government.
Government transfers accounted for 26.2% of total municipal revenue in 2025. Although this is below the peak of 33.3% recorded in 2009, it remains well above the 15.1% reported in 2006.
Operational grants made up 71% of all government transfers during 2025, with the remaining 29% allocated as capital grants for infrastructure and long term assets.
Rural and district municipalities remain the most dependent on government funding, while metropolitan municipalities continue to generate a larger share of their own revenue.
Fifteen municipalities received more than 90% of their revenue from government transfers during 2025. ZF Mgcawu District Municipality in the Northern Cape was the most dependent, with government funding accounting for 97% of total revenue. All of these transfers were operational grants.
Nama Khoi Local Municipality, also in the Northern Cape, recorded the lowest dependence on government transfers at 7%, consisting of 6% operational grants and 1% capital grants.
Municipal debt has also increased over the review period. Statistics South Africa’s debt ratio, which measures debt relative to assets, declined to 0.26 in 2011 before rising steadily to 0.38 in 2025.
Maluti a Phofung Local Municipality recorded the highest debt ratio at 2.70, followed by West Rand District Municipality at 2.32. Mnquma Local Municipality in the Eastern Cape recorded the lowest debt ratio at 0.03.
The long term data shows that while South Africa’s municipalities have substantially expanded their financial capacity since 2006, balancing operational expenditure, workforce costs, financial independence and debt sustainability remains a critical challenge for local government.
Author: Bryan Groenendaal