


 x 90px (h)")
 x 90px (h)")


 x 90px (h)")


- The South African Local Government Association (SALGA), has released their latest research report on the status of EG (Embedded Generation) in South Africa.
- The report is a collaborative effort between SALGA, Sustainable Energy Africa, the Association of Municipal Electricity Utilities Southern Africa (AMEU) and GIZ South Africa, Lesotho & eSwatini.
- SAPVIA provided data on solar PV installations.
- Most of the survey respondents indicated that their database of approved applications did not capture all the EG systems installed in their municipalities, as large numbers of systems remain unregistered.
The report takes a deep dive into the latest trends, market size, policy frameworks, and prospects of EG in South Africa. The report highlights that a big portion of solar PV installation are not registered and accounted for in network operator planning.
The report reveals a rapid uptake of EG installation in South Africa due to a number of factors, including avoiding loadshedding, electricity price increases, and steadily reducing solar PV prices. The graph of solar equipment import value reflects this exponential growth:
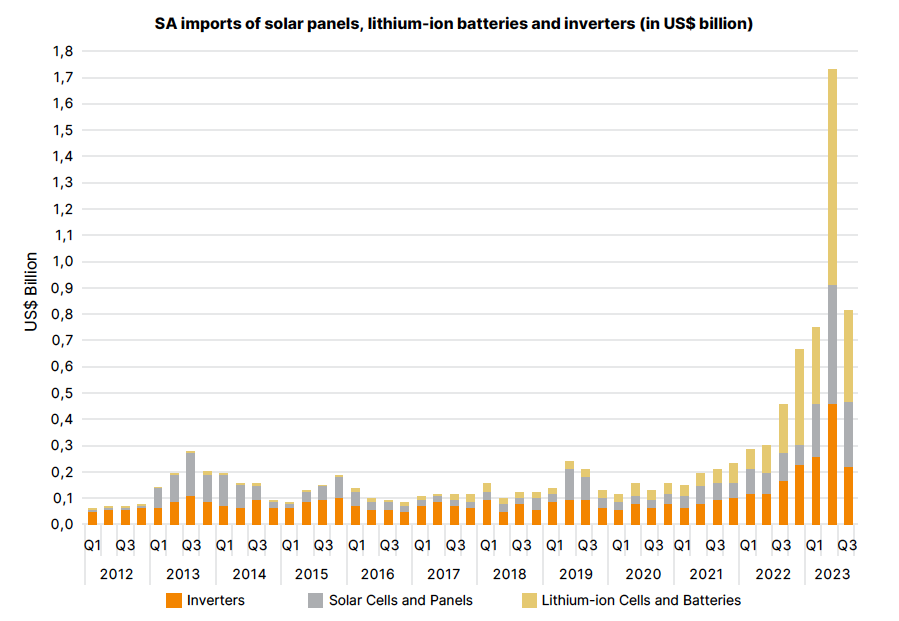
Credit: SALGA
Installed Solar PV Capacity by Market Segment (SAPVIA data):

Credit: SAPVIA
Solar PV MW by Municipal area for the top Metros and Municipalities by installed capacity (Q1 of 2023):
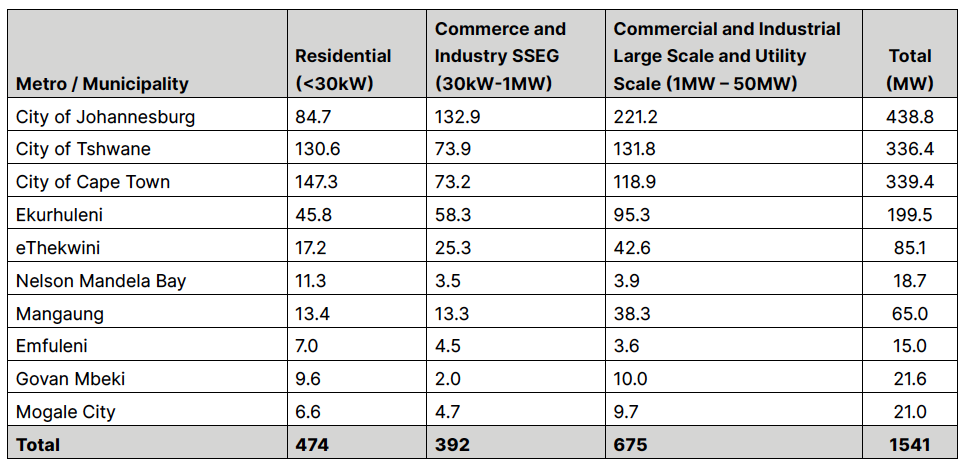
Credit: SALGA
Eskom solar PV data estimates
Similarly, a study conducted by Eskom which monitored the change in system demand due to solar radiation variations, estimated very similar figures for the first quarter of 2023, indicating that by March 2023, 3243 MWp of PV was installed, as shown in Table 2. By September 2023 this figure grew to 4883MWp19, increasing at an impressive rate of 273 MWp per month on average.
Estimated PV EG in 2023 (EG and private wheeling:
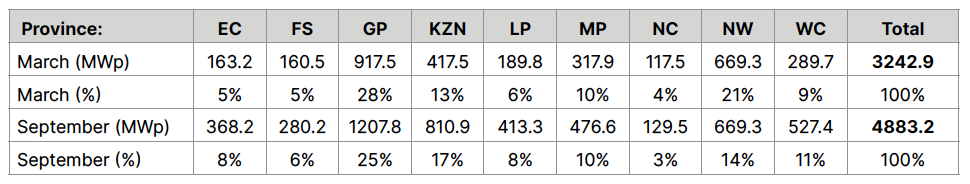
According to this study, the majority of these systems are connected in Gauteng, Kwa-Zulu Natal and the North West Province.
Unofficial installation a concern
The figure of 4883MWp has already excluded 2287MWp of solar IPPs, and thus reflects private solar for EG and wheeling. Eskom estimates that about 2.5GWp is private wheeling, leaving approximately 2383MWp as PV EG21. While some of this EG is located on Eskom’s distribution network, a significant portion is also connected to municipal distribution grids. This split is not currently known.
Based on Eskom’s estimates, the 2383MWp (as of Sept 2023) of solar PV EG represents 4% of the national total generation capacity of around 58GW. Rooftop PV is thus a significant contributor to national capacity. These systems connected to the distribution network, often unofficially, may pose challenges for network operators in future. Going forward it is important to consider how to minimise unofficial systems and maximise officially registered EG connections.
The problem of unregistered EG systems and incomplete data
Most of the survey respondents indicated that their database of approved applications did not capture all the EG systems installed in their municipalities, as large numbers of systems remain unregistered. They noted that larger systems were more likely to register (partly because they are very visible and are cautious to comply with insurance requirements) while smaller, typically residential systems tend not to. Therefore a higher percentage of small systems tend to be illegal, while more large systems are compliant.
In Eskom distribution areas a similar issue with unregistered systems appears to exist, with only 655 MW of EG being authorised by Eskom23. Combining both the SALGA municipal survey results and Eskom registered installation figures, the total still falls far short of the rooftop PV estimates recorded through the national Eskom estimates and national SAPVIA figures.
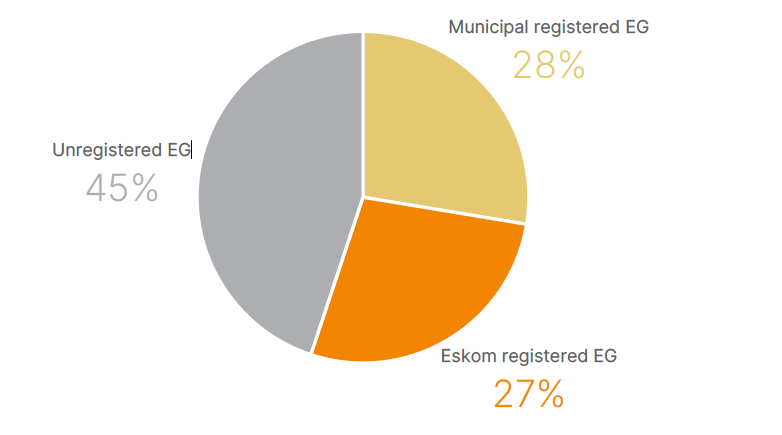
% of EG MW registered with Municipal Distributors and Eskom vs Unregistered systems. Image credit: SALGA
Find out how SALGA proposes to address the problem by linking to the full report HERE: Status of EG in South African Municipalities 2023 FINAL_140224
Author: Bryan Groenendaal

