- Every major clean energy supply chain has at least one critical weak point where less than 25% of demand can be met without the top supplier.
- Clean energy technologies market set to reach nearly US$3 trillion by 2035 despite policy and trade uncertainty.
- China retains dominant position across supply chains, creating both scale advantages and global vulnerability.
Global supply chains underpinning the fast growing clean energy economy remain highly vulnerable to disruption, even as markets expand at pace, according to the latest report from the International Energy Agency.
The Energy Technology Perspectives 2026 report finds that every major supply chain for technologies such as electric vehicles, batteries and solar PV contains at least one weak link. In these segments, less than 25% of global demand could be met if the largest supplier were removed, highlighting significant risks to energy security and industrial resilience.
This concentration is particularly pronounced in China, which accounts for between 60% and 85% of production capacity across key clean energy technologies, and more than 95% in some segments. A disruption in exports could have immediate economic consequences. For example, a one month halt in battery exports from China could result in losses of around US$17 billion for electric vehicle manufacturers globally.

Notes:
STEPS = Stated Policies Scenario; EMDEs = emerging markets and developing economies; AEs = advanced economies. Trade is in net terms by technology, based on the regional groupings used in the Manufacturing and Trade model, which align with those used in the Global Energy and Climate model. Intra-regional trade is not included. Sources: IEA analysis based on a range of data sources; see model documentation for details.
Despite these risks, clean energy markets continue to expand rapidly. The global market value of clean energy technologies has grown by around 20% annually over the past decade, reaching close to US$1.2 trillion in 2025. Under current policy settings, this is expected to double to around US$2 trillion by 2035. With stronger policy support, the market could approach US$3 trillion over the same period.
Electric vehicles are set to dominate this growth, accounting for roughly 75% of total market value by 2035 across all scenarios.
Low emissions fuels are also gaining ground, with market value projected to rise from about US$215 billion in 2025 to nearly US$390 billion by 2035. Much of this growth is driven by established biofuels such as biomethane, bioethanol and biodiesel, while newer fuels like sustainable aviation fuels and hydrogen based options will require stronger policy backing to scale.
However, the outlook for near zero emissions materials such as green steel and low carbon cement remains uncertain due to high production costs. Market value for these materials is expected to reach just US$5 billion under current policies, or up to US$20 billion with stronger support by 2035.
China plays an outsized role in clean energy technology supply chains
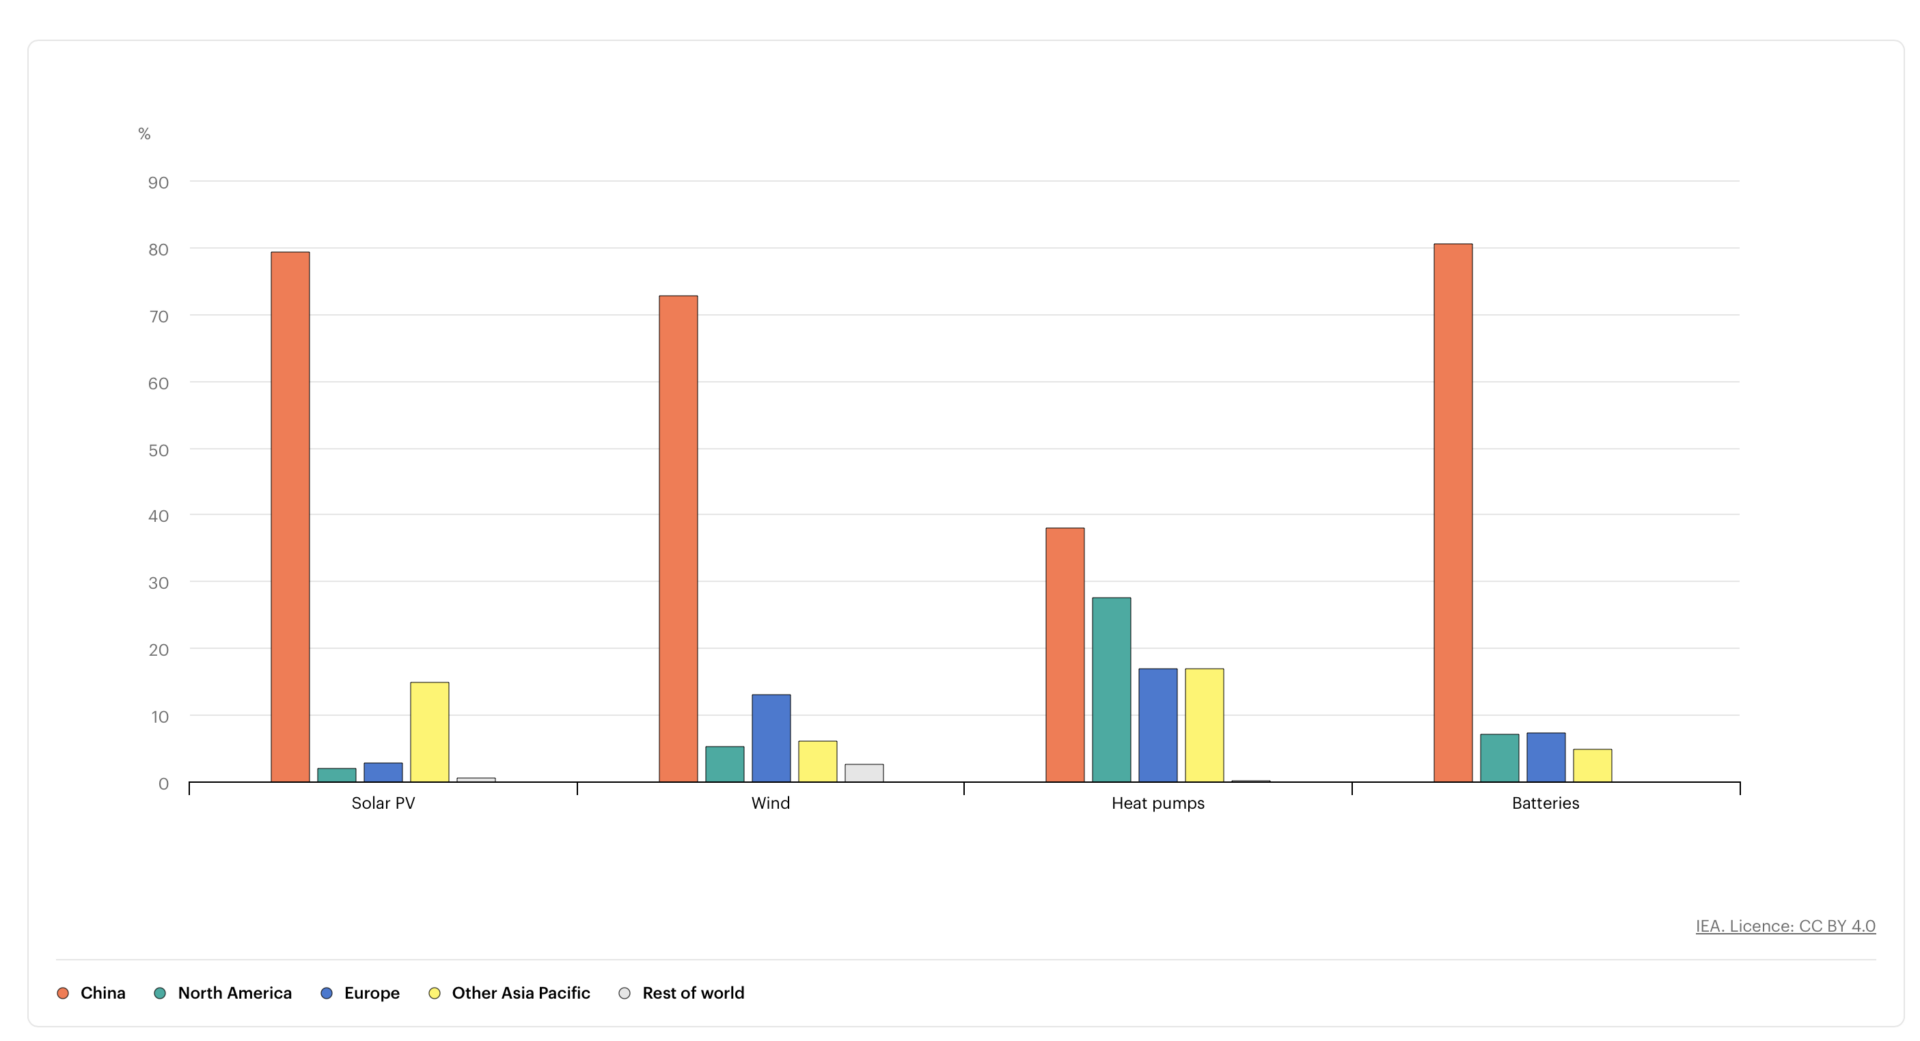
Sources: IEA analysis based on a range of data sources; see model documentation for details.
Notes: Solar PV refers to modules, Wind to wind turbine nacelles, and batteries to battery cells.
Technology progress continues to improve competitiveness. Around 80% of global solar and wind generation is now cheaper than fossil fuel alternatives, while battery costs have fallen by 75% over the past decade. In some emerging markets, electric vehicles are already cheaper than internal combustion engine cars.
At the same time, emerging technologies such as hydrogen, carbon capture and near zero emissions industrial processes are advancing, though at a slower and less predictable pace. Investment in low emissions hydrogen reached nearly US$8 billion in 2025, up 80% year on year, while carbon capture investment has grown more than fifteenfold since 2020 to exceed US$5 billion.
Trade remains central to the sector, even as governments introduce tariffs and industrial policies to protect domestic industries. Global trade in clean energy technologies is projected to more than double from US$290 billion in 2025 to US$620 billion by 2035.
China continues to dominate exports, with net exports expected to reach US$375 billion by 2035. Its electric vehicle exports alone were valued at around US$50 billion in 2025, with a growing share directed towards emerging markets.
The report also highlights shifting investment patterns. Global manufacturing investment declined slightly to just under US$200 billion in 2024 and is expected to soften further through 2025, largely due to excess capacity in solar and battery manufacturing.
Looking ahead, investment trends will increasingly be shaped by efforts to diversify supply chains. The combined share of the United States and European Union in global clean technology manufacturing investment is projected to rise from less than 25% in 2024 to over 35% in the early 2030s.
Industrial competitiveness remains a key challenge. China’s cost advantage is driven by scale, efficiency, skilled labour and long term policy support. In comparison, higher energy and labour costs continue to weigh on manufacturing in regions such as Europe.
For energy intensive industries, access to low-cost power will be critical. Regions with abundant renewable energy resources, including parts of the Middle East and North Africa, could emerge as competitive production hubs for materials such as green hydrogen and low emissions steel.
The report concludes that no single strategy will close the competitiveness gap. Instead, countries will need to leverage their strengths and build strategic partnerships to diversify supply chains, reduce costs and enhance resilience in the global clean energy transition.
Link to the full report HERE
Author: Bryan Groenendaal